
Guide to reduce and slice POWGEN data for PDF analysis using MantidPlot on local or ORNL analysis systems.
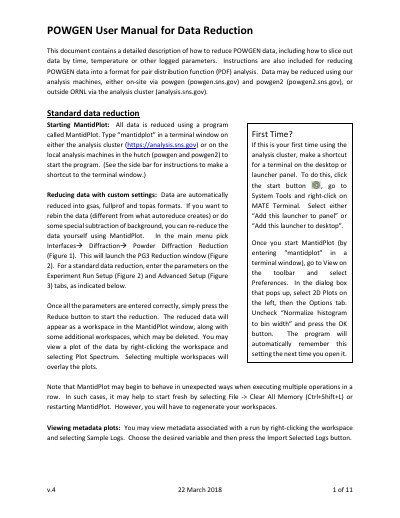
This manual explains how to process POWGEN data using MantidPlot, including setting up reduction parameters and slicing data by time or temperature. It covers both standard and custom reduction workflows, with instructions for using local machines (powgen.sns.gov, powgen2.sns.gov) or ORNL’s analysis cluster (analysis.sns.gov). The guide also addresses metadata handling, binning, and viewing results with plots and workspace overlays.
The manual includes detailed setup instructions for Experiment Run Setup and Advanced Setup tabs, with guidance on calibration, characterization files, output formats, and binning parameters. It also explains how to slice data by log values such as temperature using Event Filters Setup, including options for time-based or value-based slicing, and how to handle and visualize the resulting datasets.
| Output File Formats | gsas, fullprof, topas, pdfgetn, processed nexus |
|---|---|
| Binning Value | ∆t/t |
| Default Binning | 0.0008 |
| Background Smoothing Parameters | 5,2 for vanadium cans; 40,10 for quartz tubes |
| Remove Prompt Pulse Width | 50 |
| FilterBadPulses | 10 |
Type “mantidplot” in a terminal window on either the analysis cluster (https://analysis.sns.gov) or on the local analysis machines in the hutch (powgen and powgen2) to start the program.
The default output formats are gsas, fullprof, topas, pdfgetn, and processed nexus.
You can add a constant value (AddMinimum), reset to zero (ResetToZero), or leave unchanged (None).