
The Desmos Online Graphing Calculator User Guide explains how to create, edit, save, and share graphs, use sliders, tables, and keyboard shortcuts.
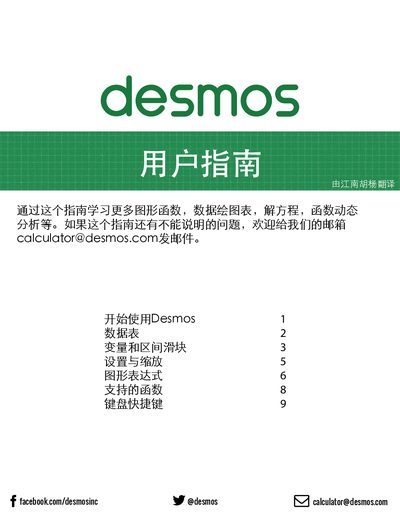
This guide walks you through the basics of using Desmos, from starting a new graph and entering expressions to managing data tables and variables. It shows how to save, rename, and share your work, as well as how to customize the appearance of graphs.
Additional sections cover settings and zoom options, different graph types, creating movable points, defining custom functions, and a full list of supported functions and keyboard shortcuts for efficient workflow. This manual is written in Chinese.
Click the save button or press Ctrl+S to save the current graph.
When a free variable appears, the system prompts you to define it with a slider.