
eastviewer is a tool for graphical display of efit algorithm results. It can read relevant data from files (efit algorithm generated afile, gfile, etc.) or mdsplus database, and display the corresponding graphics and parameter values according to requirements.
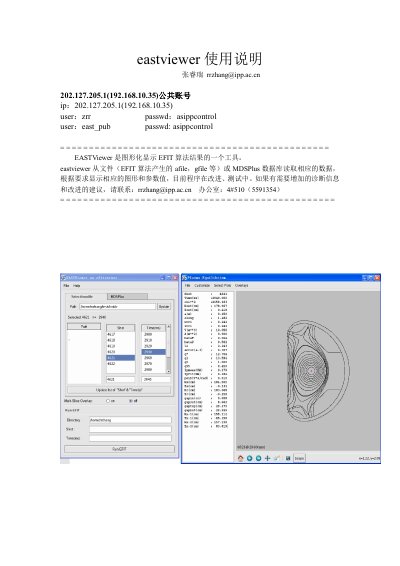
EastViewer is a graphical tool for visualizing the results of the EFIT algorithm. It can read data from EFIT output files (such as afile and gfile) or directly from an MDSPlus database, then display plasma equilibrium parameters, boundaries, and magnetic flux diagrams. The interface allows selection of shots and time slices, and offers features like contour adjustment, animation of multiple slices, and diagnostic overlays.
The manual explains how to log in to the EFIT server via Xmanager, launch EastViewer, navigate the main window, and use the Preference, Animation, Customize, and EFIT Pointnames dialogs. It also covers troubleshooting steps for common issues such as missing jScope window titles and unresponsive time‑slice selections. This manual is written in Chinese.
| Supported data sources | EFIT afile, gfile, MDSPlus database |
|---|---|
| Number of contours | Set to 0 to view SOL magnetic flux |
| Animation multi‑slice | Enable ‘on’ to display multiple time slices dynamically |