
This document provides a quick reference guide to ABDR, including information on patient types, patient transitions, interactions, MyABDR treatments, and the top 10 products over the past 12 months.
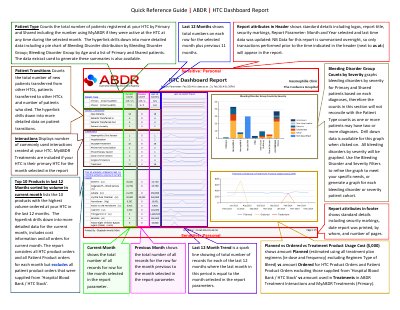
ABDR HTC Dashboard Report Quick Reference Guide describes the Last 12 Months report, including Patient Type, Patient Transitions, Interactions, Top 10 Products, trend and cost sections.
It also explains report attributes in the header and footer, data update timing, and the Bleeding Disorder Group Counts by Severity graph and its filters.
It counts the total number of patients registered at your HTC by Primary and Shared, including the number using MyABDR if they were active at the HTC at any time during the selected month.
Data for this report is summarised overnight, so only transactions performed prior to the time indicated in the header will appear in the report.
The counts are based on each diagnosis, and one or more patients may have two or more diagnoses.