
This document is the Tacoma and Pierce County Equity Index User Guide and FAQs user manual, which introduces how users use this tool
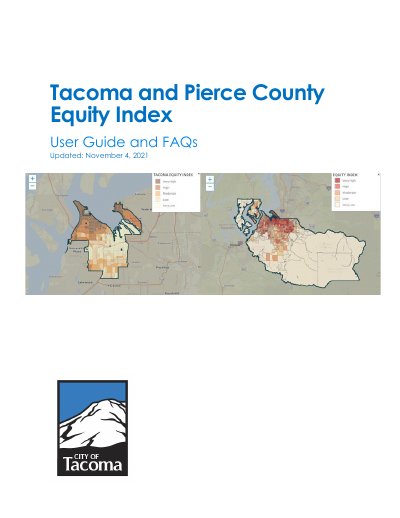
The Tacoma and Pierce County Equity Index User Guide and FAQs explains the Community Opportunity Maps (COM) mapping platform, developed by Community Attributes Inc. and customized for the City of Tacoma and Pierce County. The guide describes the Tacoma Equity Index, its 29 data points across five determinant categories, the Pierce County Equity Index, and how the map displays community indicators.
The walkthrough covers map basics such as zooming and moving the map area, searching for a city or address, selecting a county, ZIP code or state, drawing a custom area, changing the map view, adding an indicator layer, and reading the Community Indicators Dashboard. An FAQ appendix and a feedback contact are also included.
| Data points | 29 |
|---|---|
| Determinant categories | Accessibility, Economy, Education, Livability, and Environmental Health |
| Geographic data level | Census Block Group |
| Coverage | Tacoma and unincorporated Pierce County |
| Mapping platform | Community Opportunity Maps (COM) |
It is an interactive tool that visually highlights disparities in Tacoma using 29 data points sorted into five determinant categories.
They are Accessibility, Economy, Education, Livability, and Environmental Health.
Use the + and – buttons in the top left corner of the map area, or use the scroll wheel while hovering over the map.
You can select a census block group, neighborhood, council district, business district, congressional district, city boundary, search by address, or draw boundaries on the map.