
This is a web user manual that introduces how to save elements in Canvas sheets.
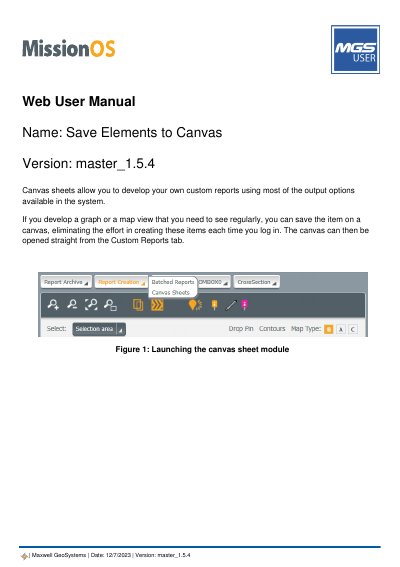
This manual explains how to save maps, graphs, and cross sections to custom canvas sheets for easy reuse in reports. Users can drag and drop elements onto a canvas, resize them, and save the canvas for future use. The canvas can be accessed from the Custom Reports tab or via the front portal under Report Creation > Canvas Sheets. The document also includes instructions for adding elements via the Save Map function and using the Cross Section tool.
Click Save Map, then click Add Map to Canvas Library. Enter a title, select instrument display options, and click Add to Library.
Select Cross Section, draw a line across the map, set the selection radius, then click Add to save the cross section or View Large to view it. Click the hamburger icon and select Add to canvas sheet.